Zadig Toolkit
Zadig Toolkit is a Visual Studio Code extension for Zadig, a product under KodeRover. This extension allows developers to access Zadig's core capabilities directly in their IDE without the hassle of platform switching, enabling easy viewing, service debugging and upgrades, restarting, and real-time log viewing of Kubernetes environments in Zadig projects. During daily development, after code modifications, developers can hot-deploy services to Zadig cloud without committing to Git repositories or building images, facilitating service self-testing, integration testing, and validation. Currently, Zadig Toolkit supports the following features:
- Zadig environment viewing
- Microservice restart, service image replacement, service detail viewing, Pod real-time log viewing, login to service instance Pod
- Remote debugging of local applications, configuring remote development environments
Version Compatibility
The Zadig Toolkit extension supports versions v1.12.0 - v1.16.0.
# Prerequisites
- System preparation: Install Zadig v1.12.0+ version
- Project preparation: Refer to How to Use GitHub + Zadig to Achieve Production-Level Continuous Delivery(opens new window)
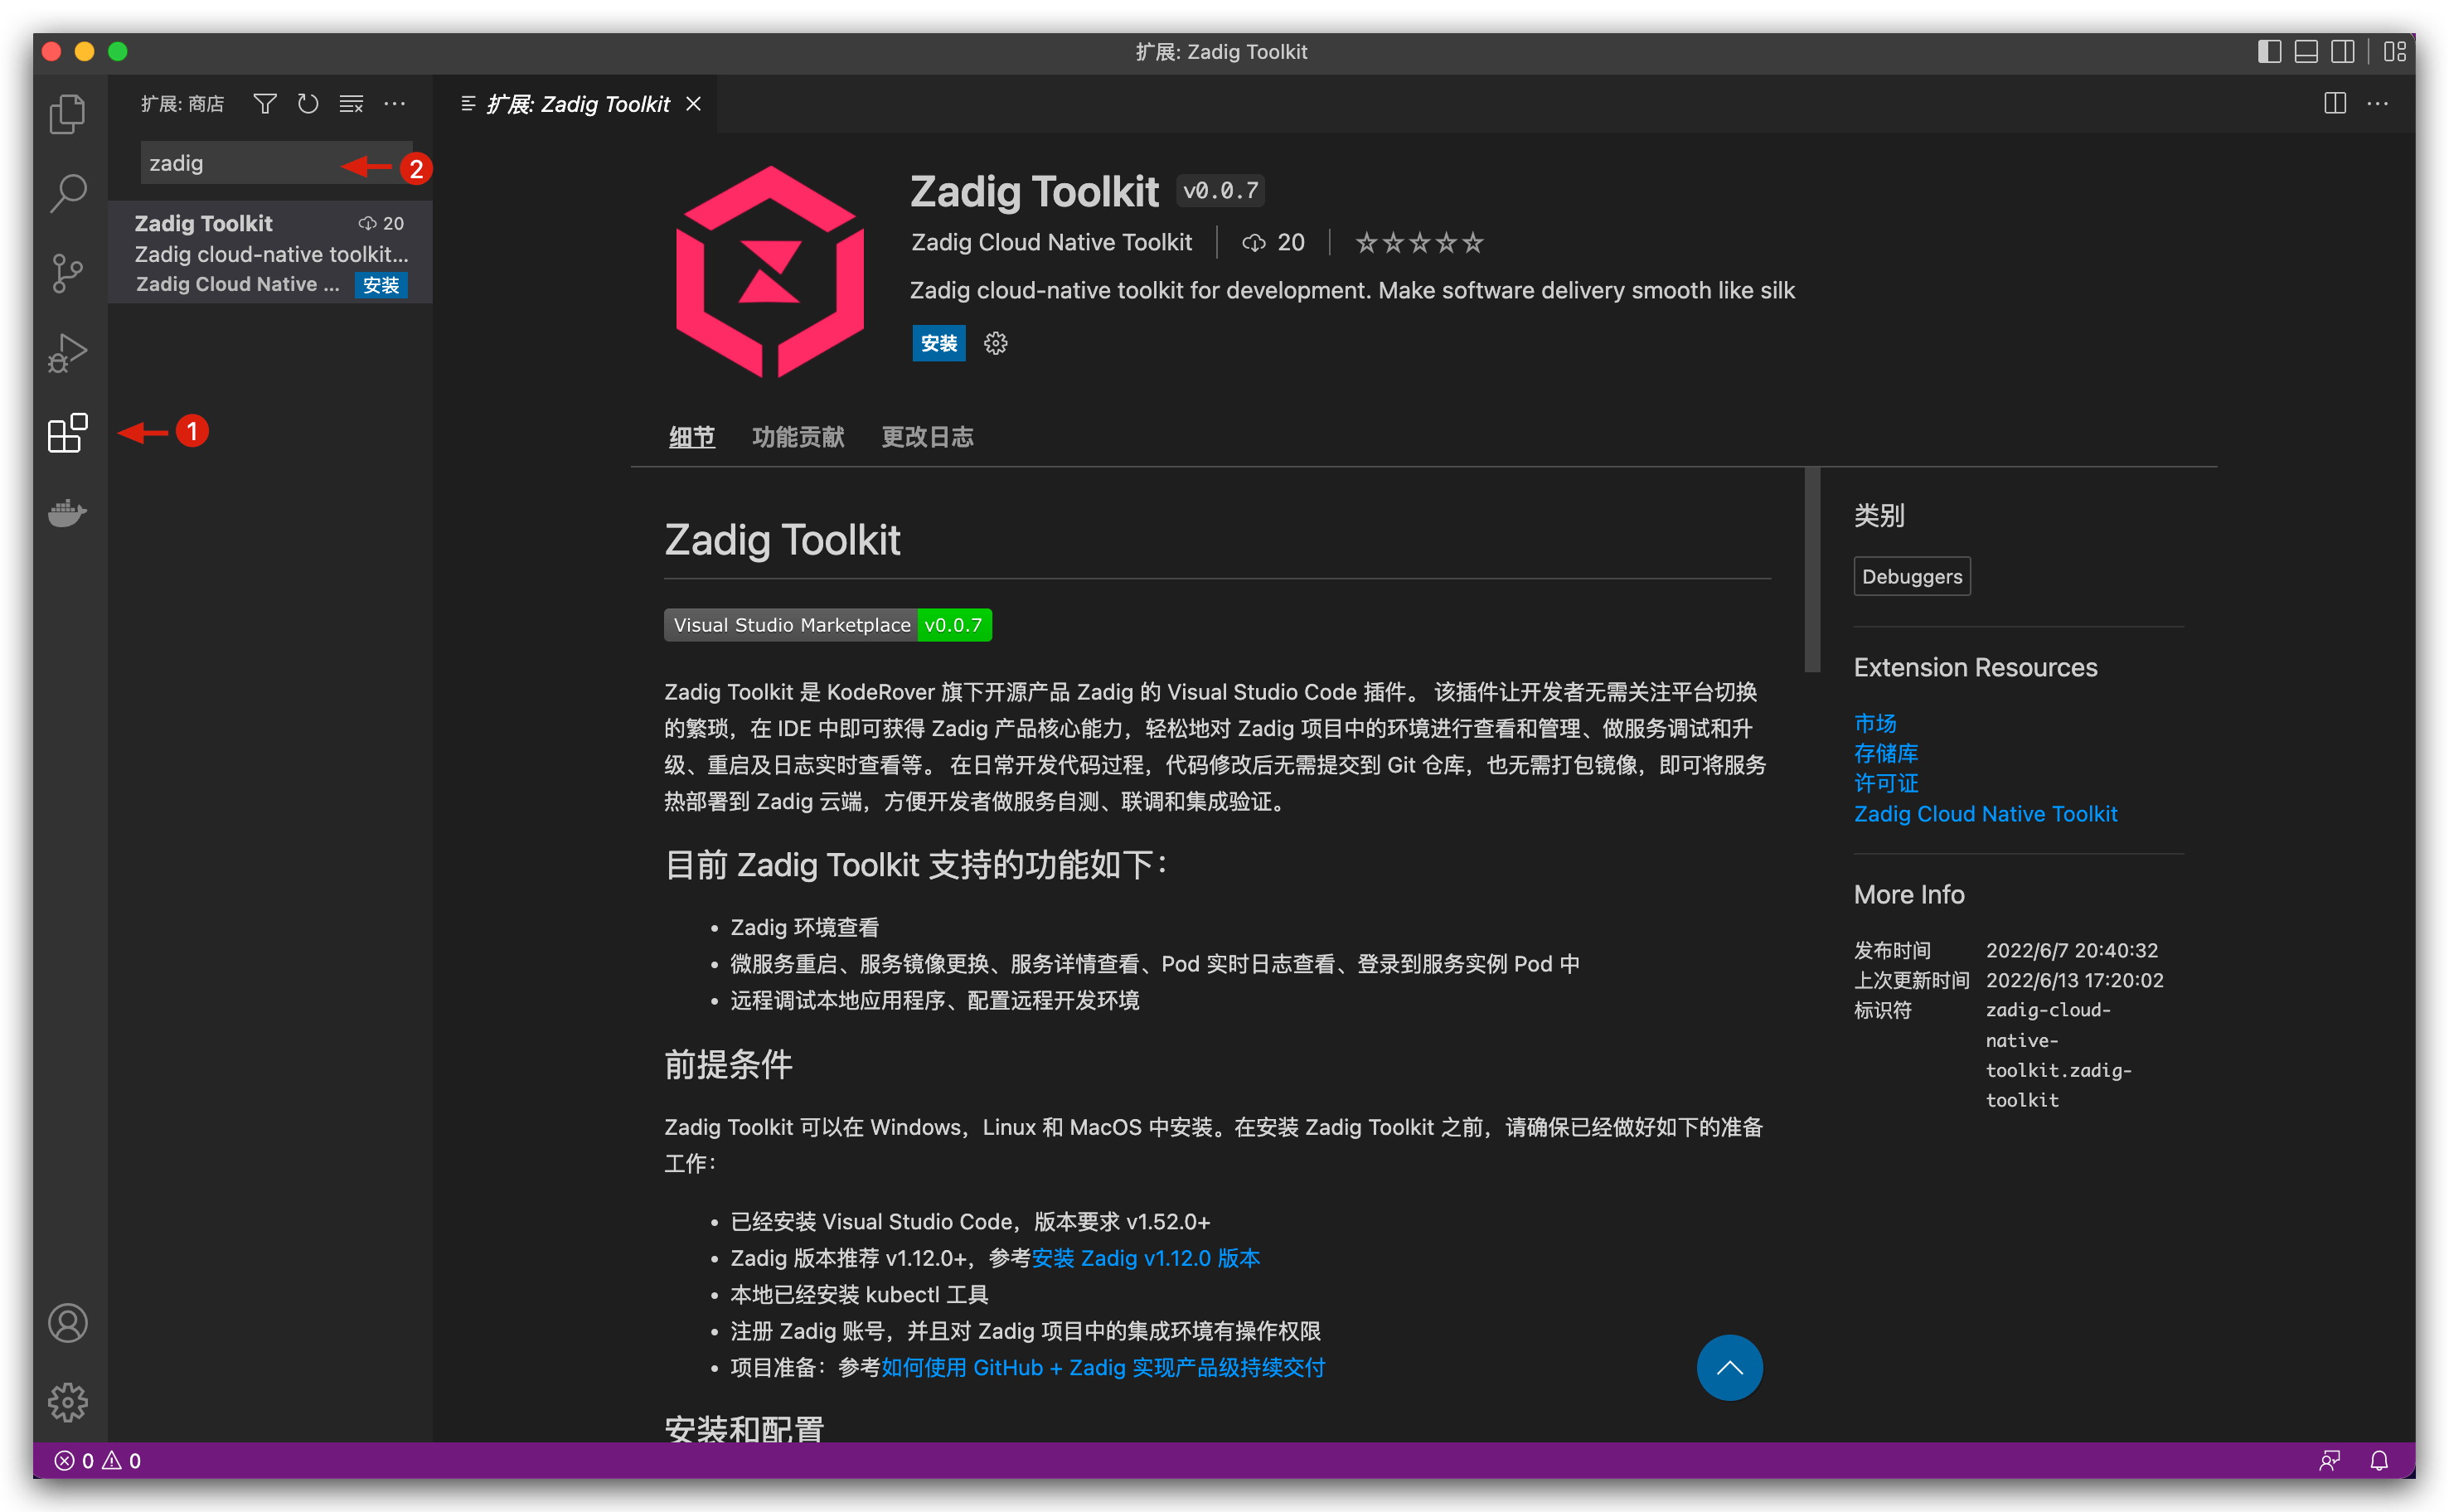
# Install Extension
- Open Visual Studio Code and go to the marketplace.
- Search for
Zadig Toolkitin the marketplace, view details and install.
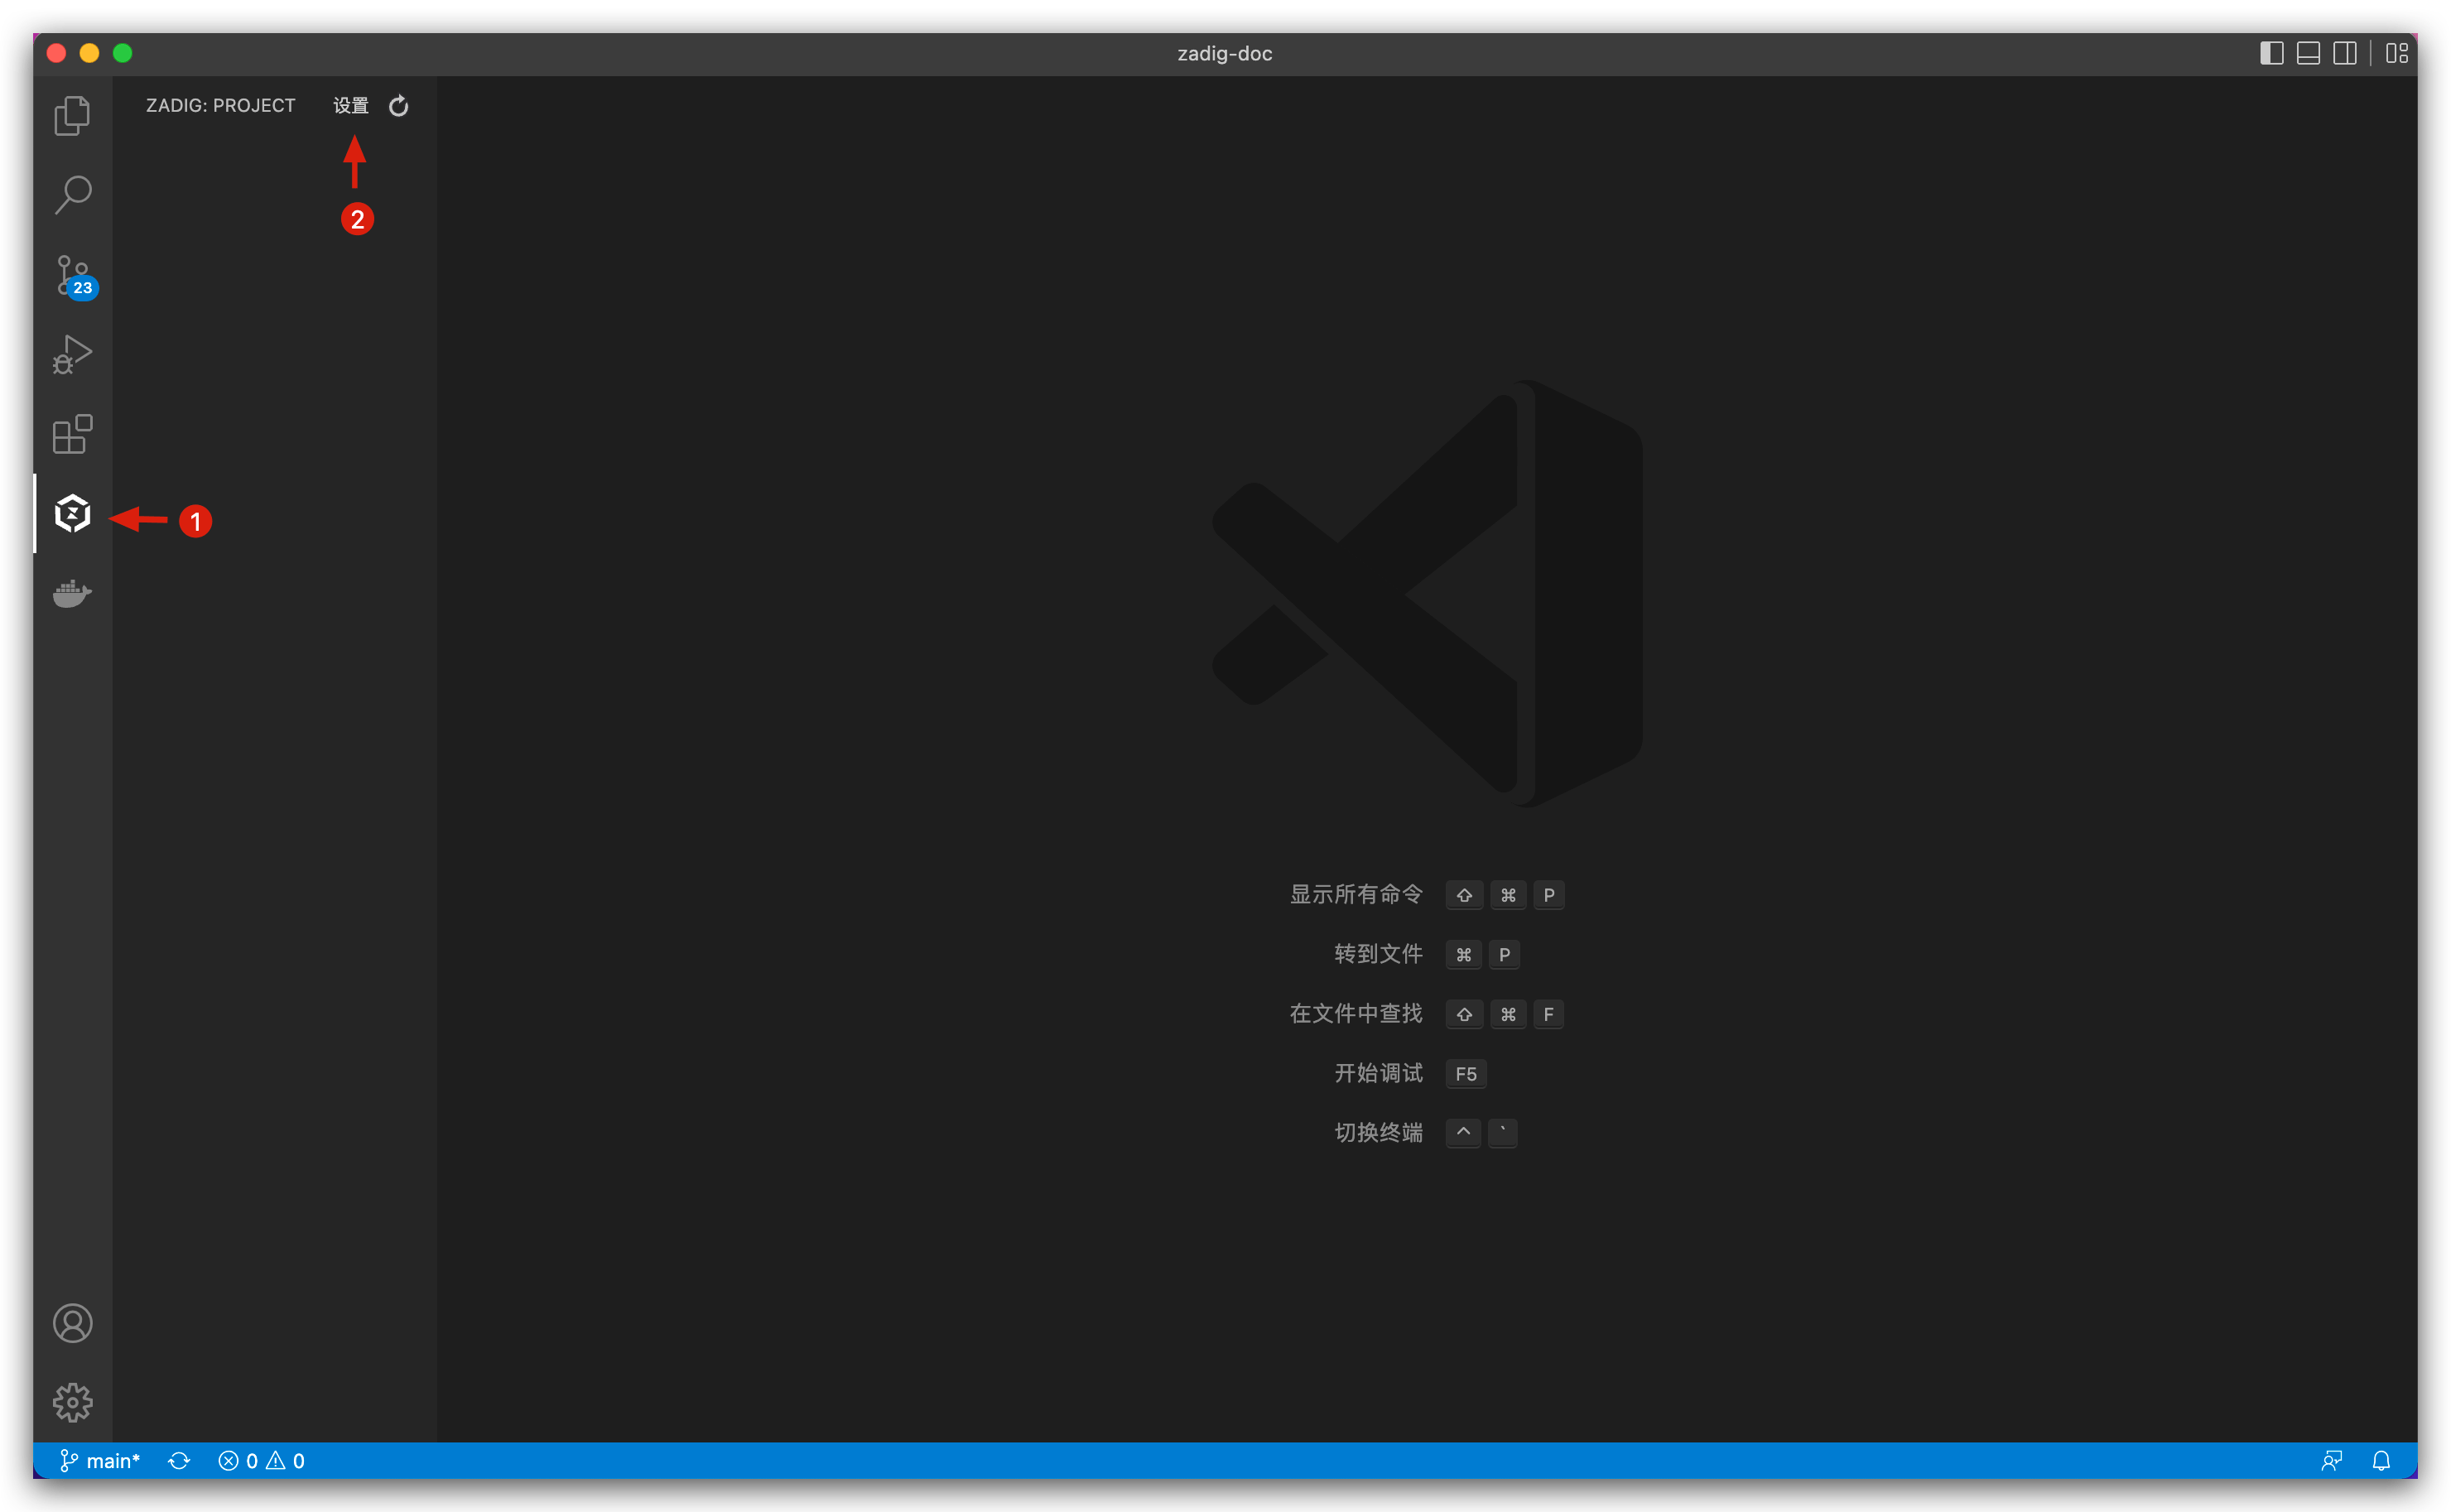
# Configure Extension
- Open the installed Zadig Toolkit extension.
- Click
Settingsto enter the extension configuration page.
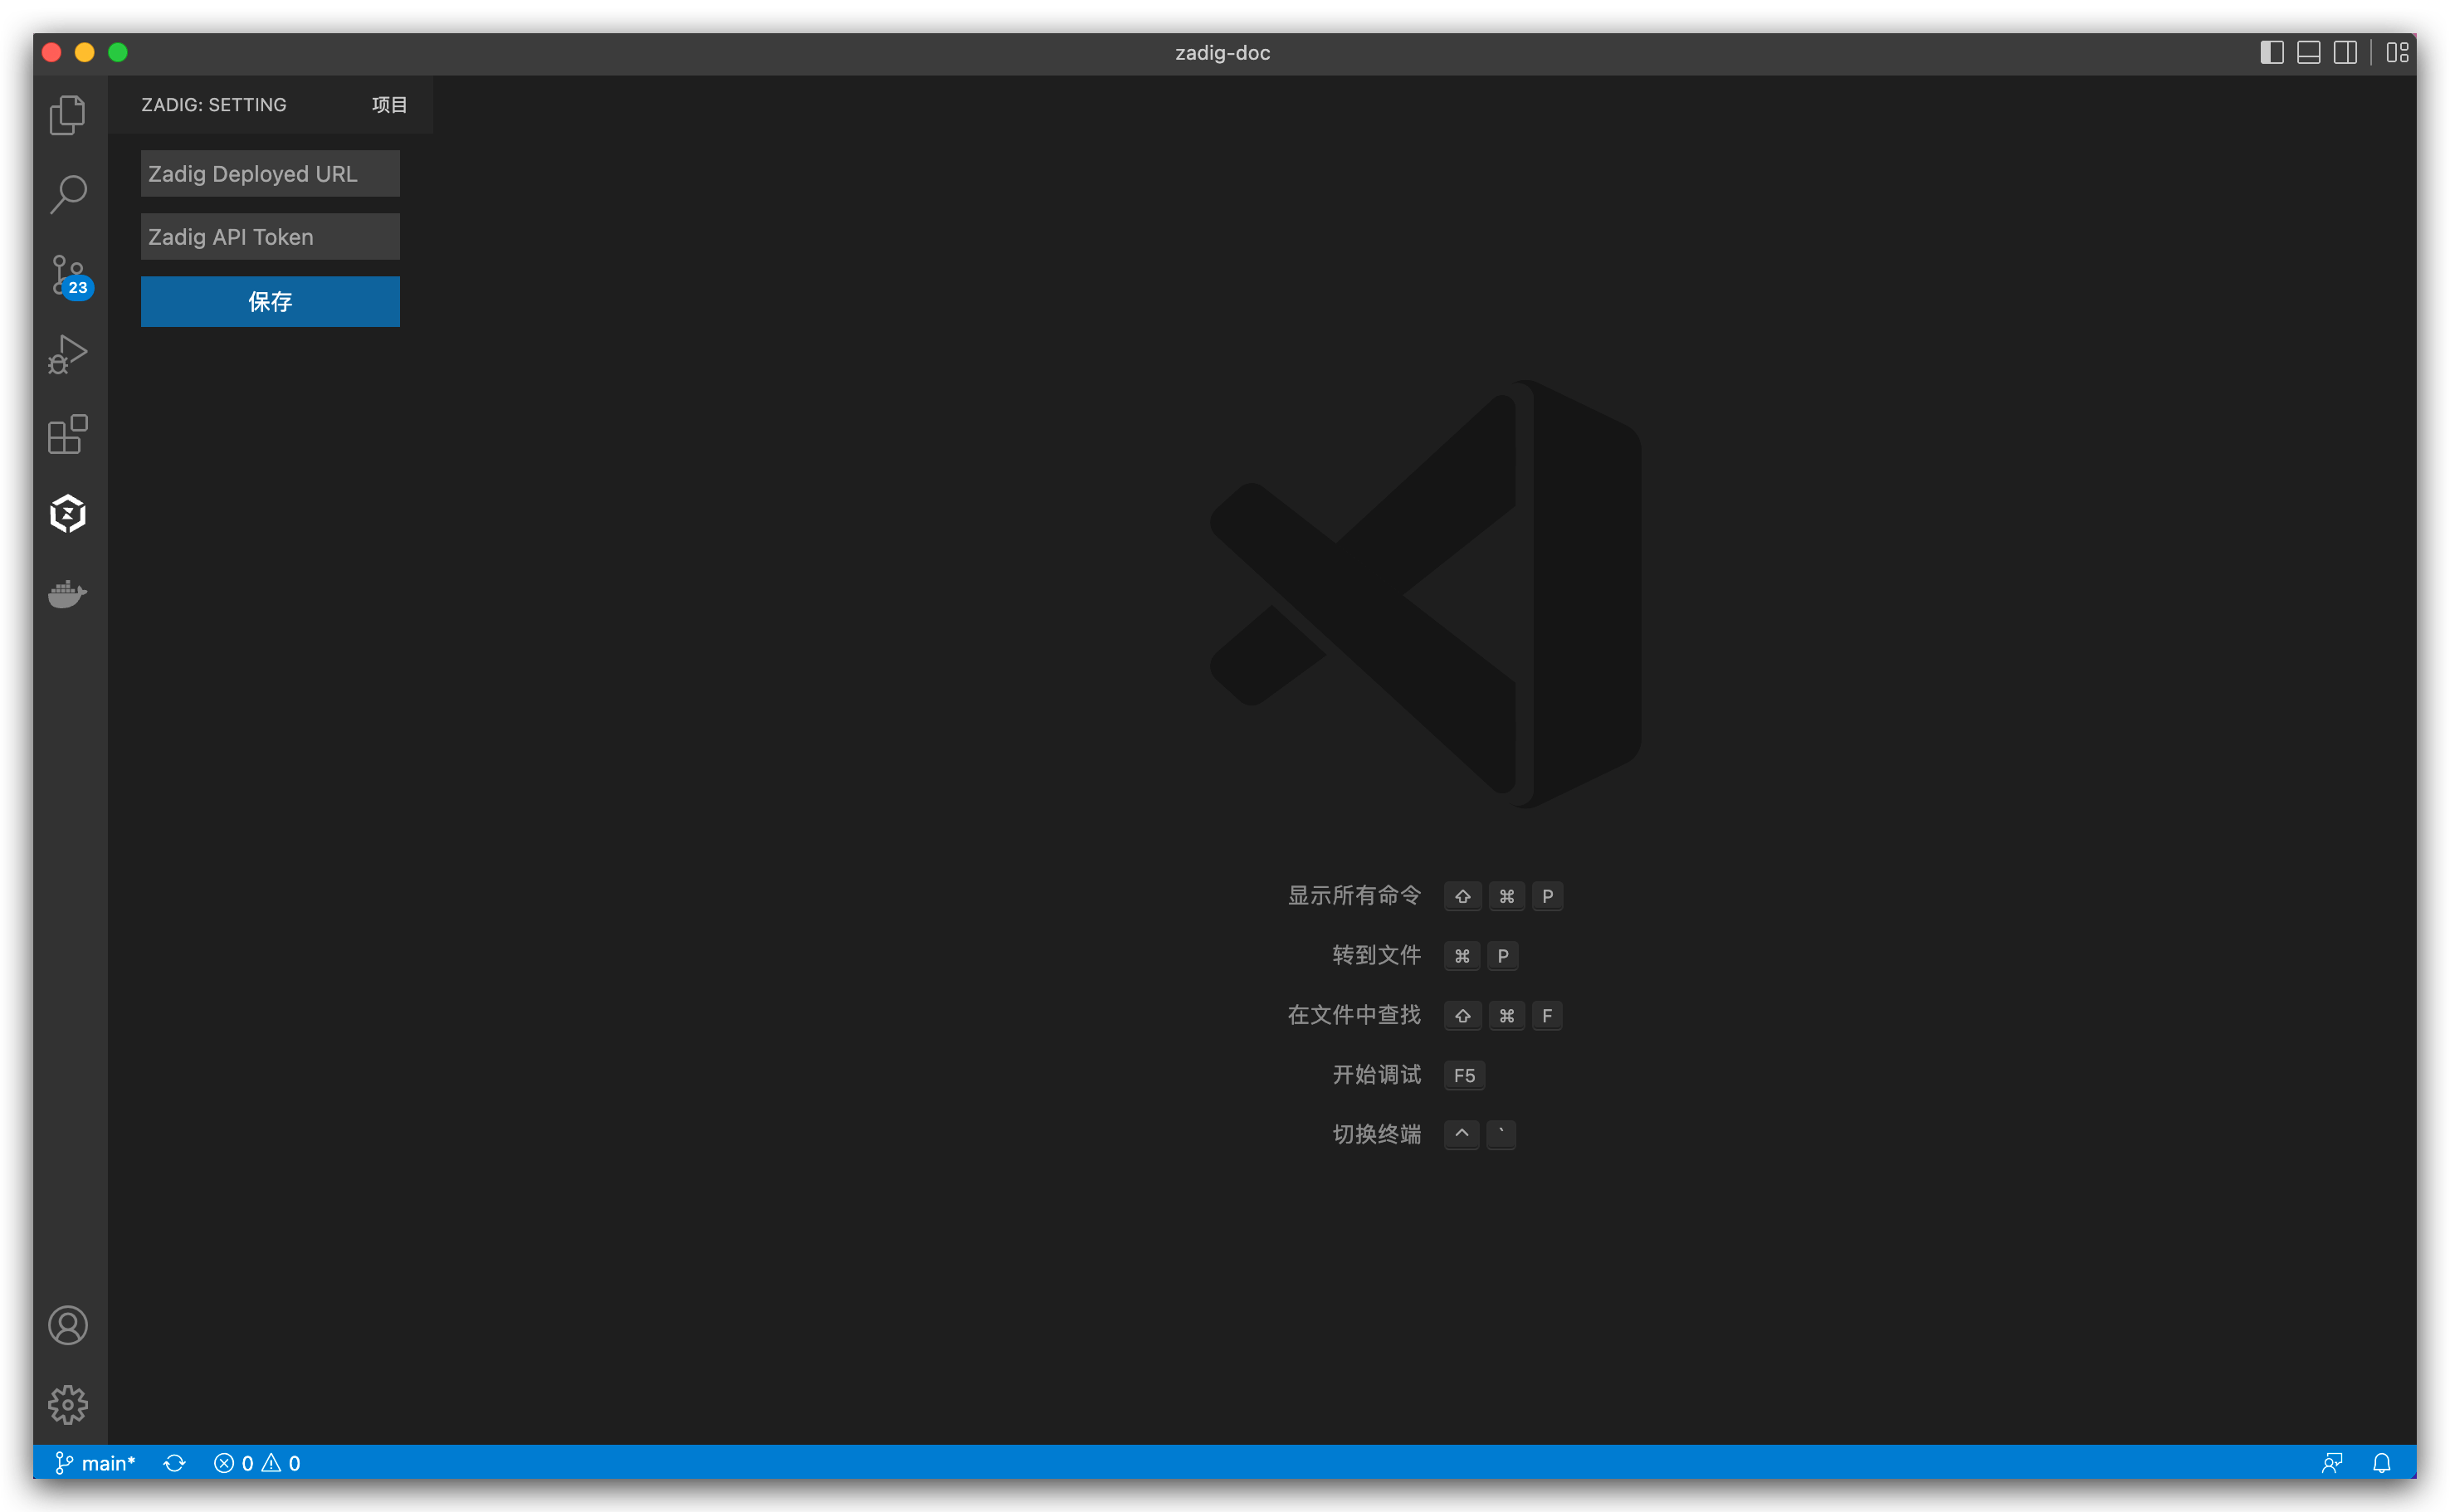
Configuration Parameter Description:
- Zadig Deployment Address: Please fill in the complete URI according to the actual protocol, for example:
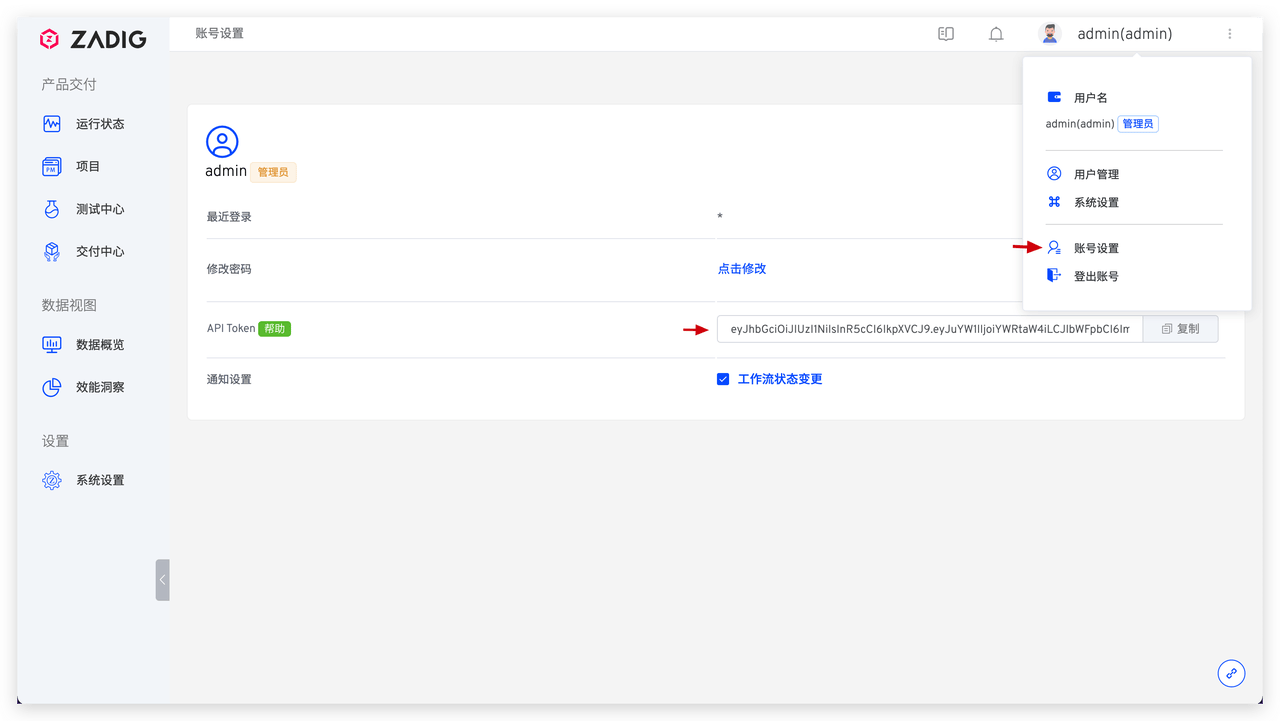
http://zadig.com. - Zadig API Token: Enter the Zadig system, click
Account Settings, as shown in the figure below.
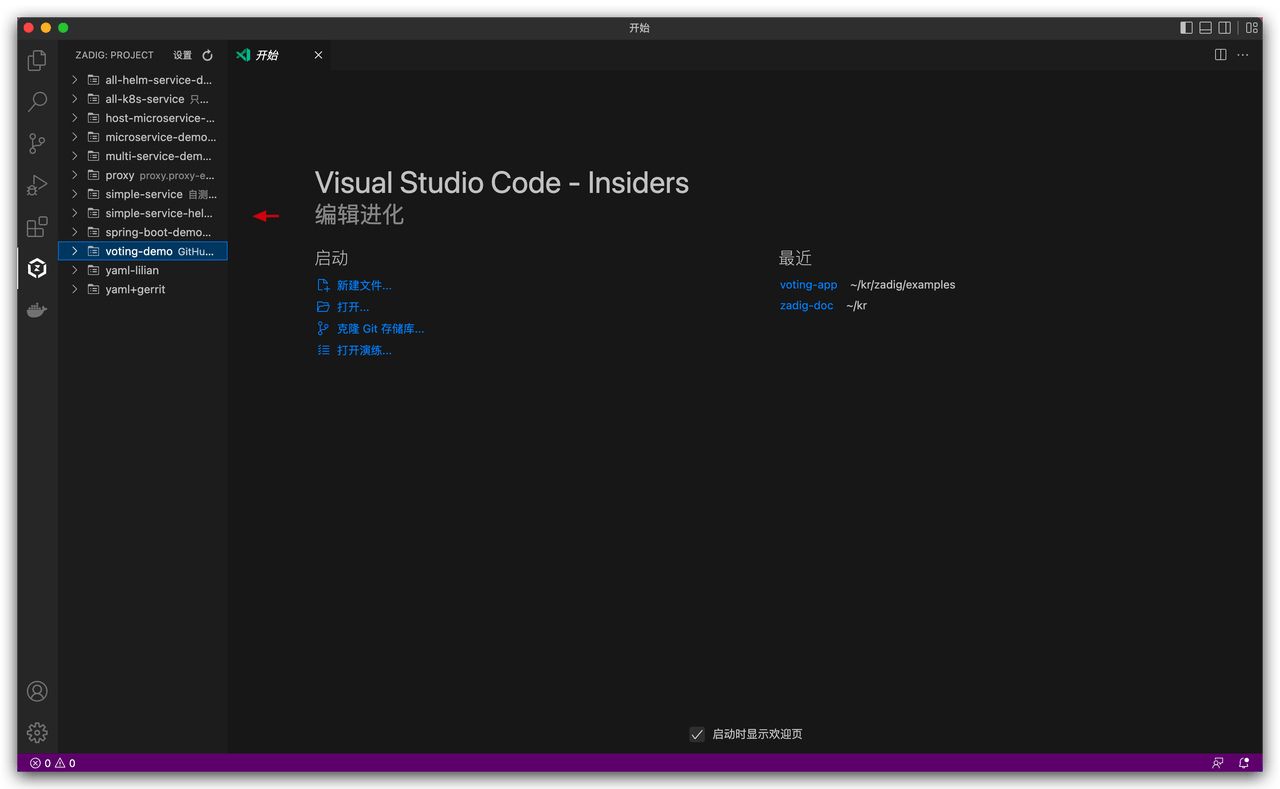
After configuration is complete, you can see projects in the Zadig system in the left sidebar.
# How to Use
# Remote Debugging of Local Code
Below, using the prepared voting-demo project as an example, we'll introduce how to perform remote debugging through Zadig Toolkit.
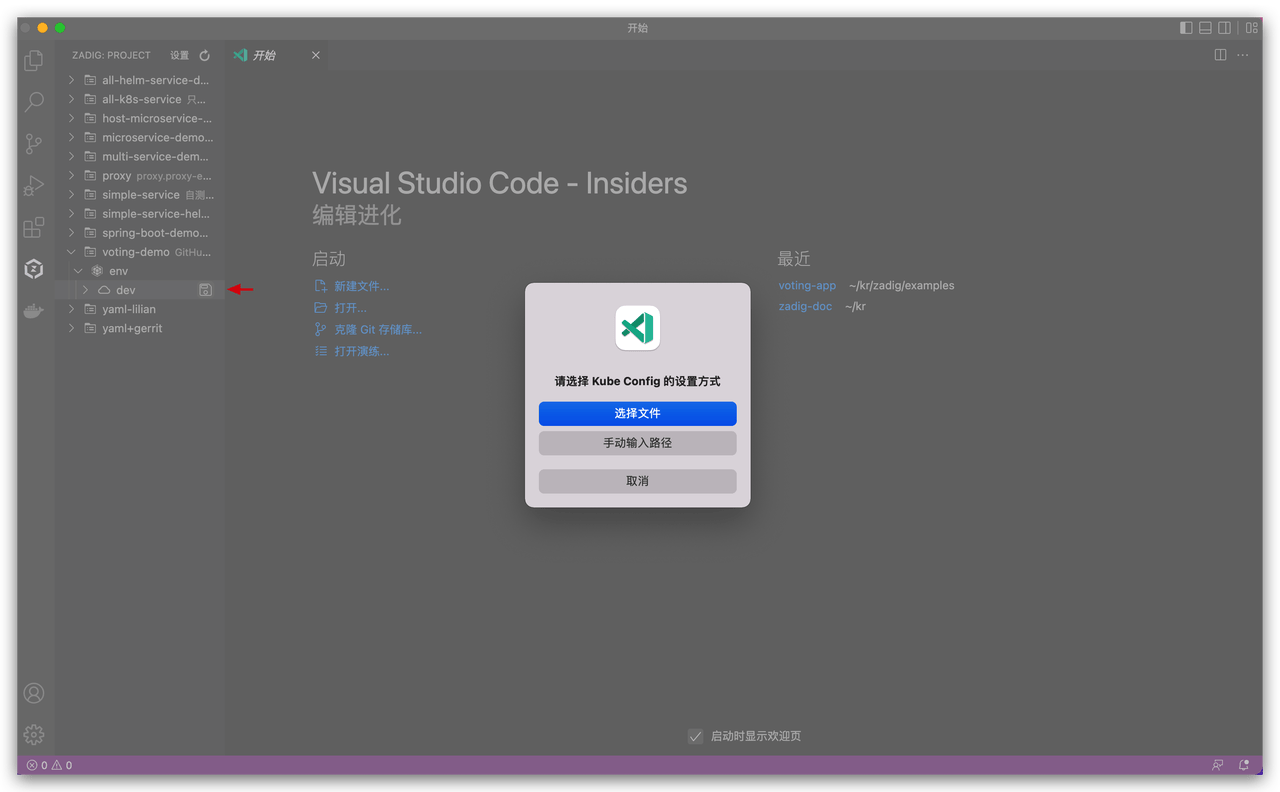
- Select the
voting-demoproject ->devenvironment, click the icon on the right side of the environment to set Kube Config (i.e., the config configuration file of the cluster where the dev environment is located), you can select this configuration file in the file directory or manually enter its path and press Enter.
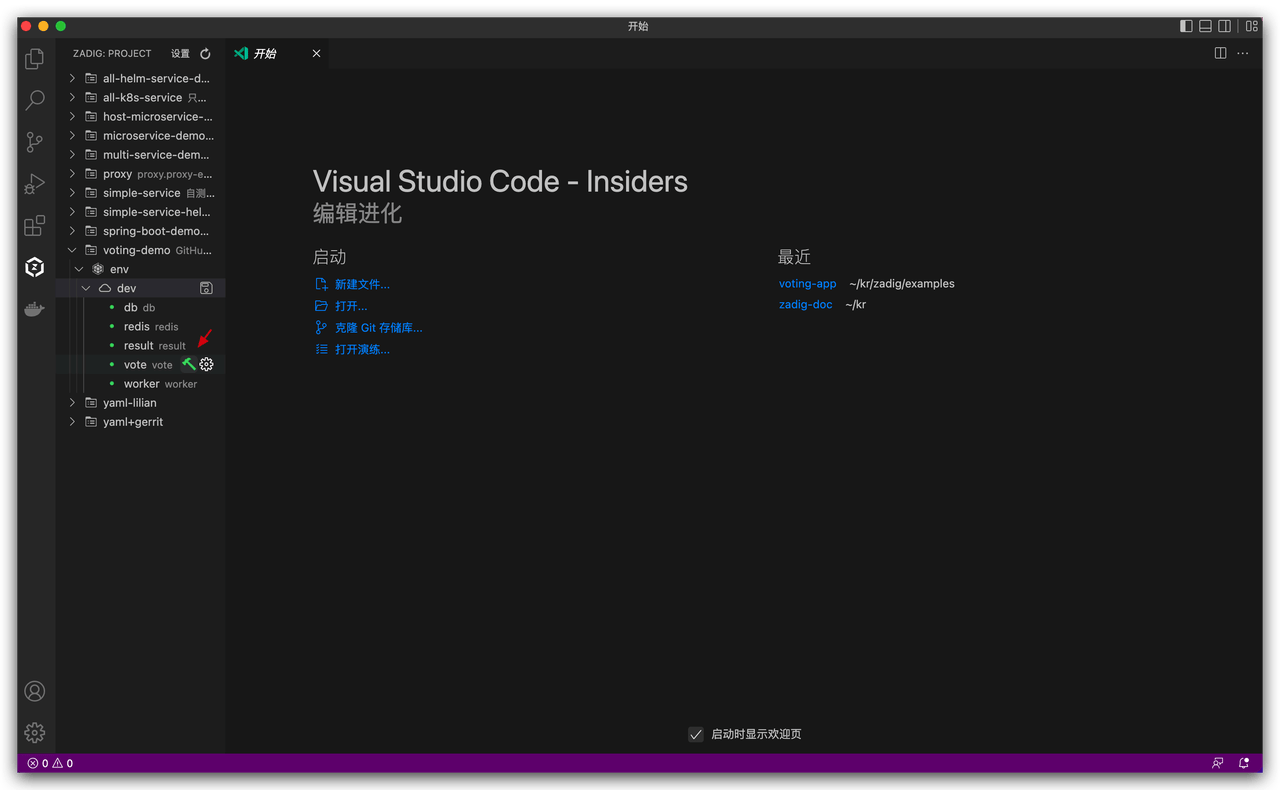
- Select the
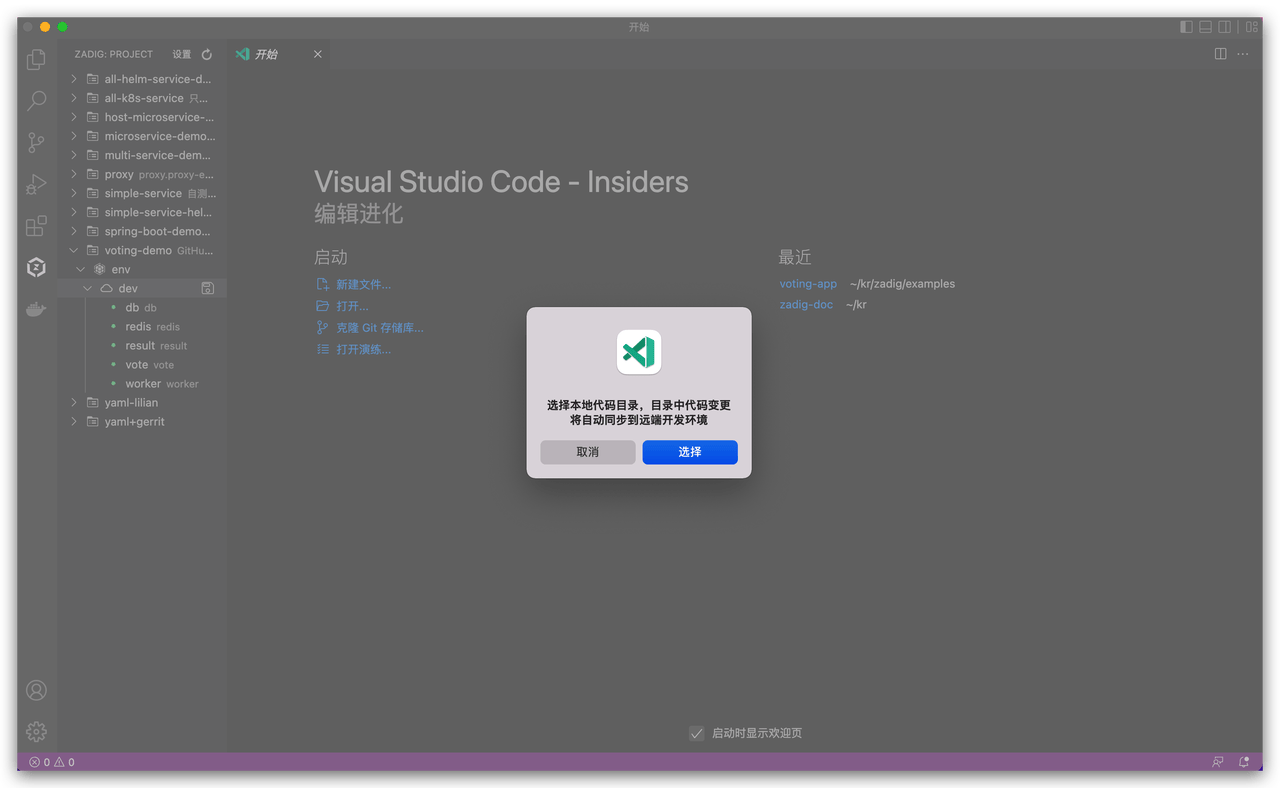
voteservice, click the debug button to enter development mode.
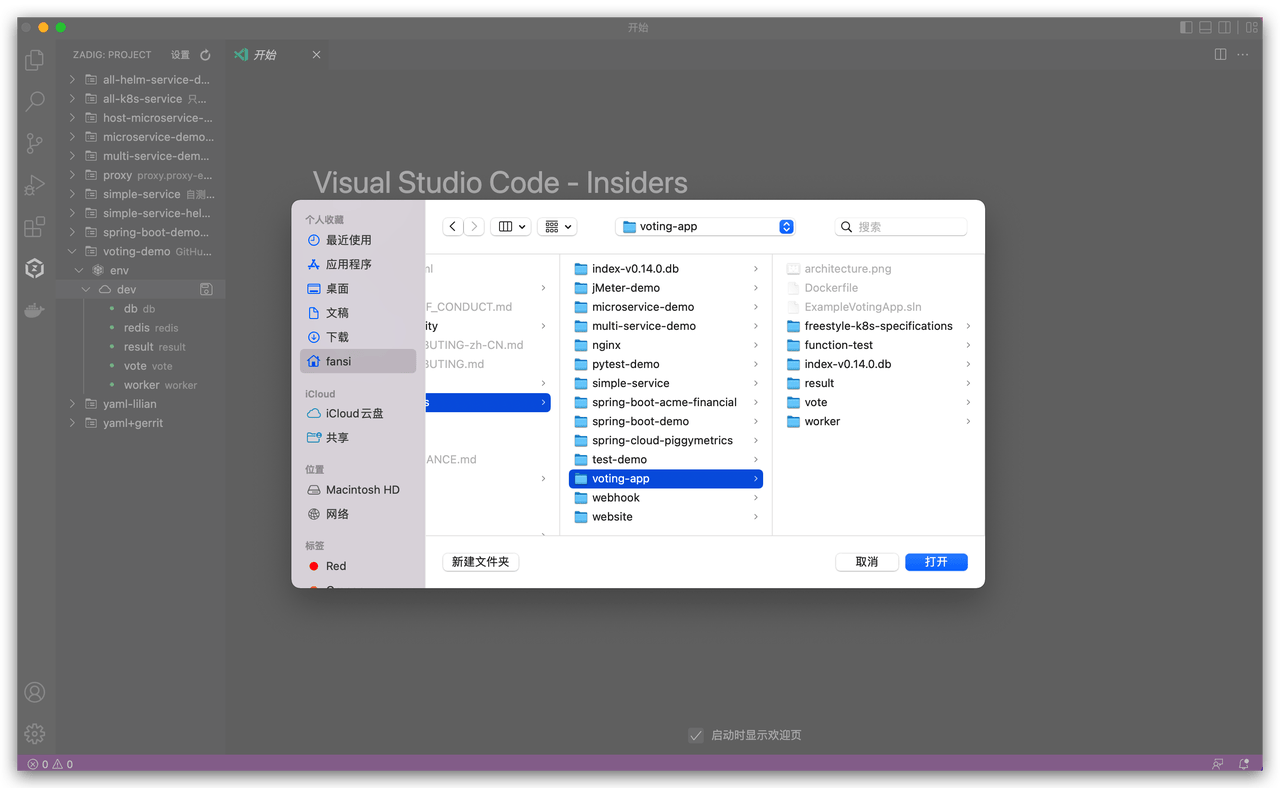
- Select the local development code directory, in this example it's koderover/zadig(opens new window) -> examples -> voting-app.
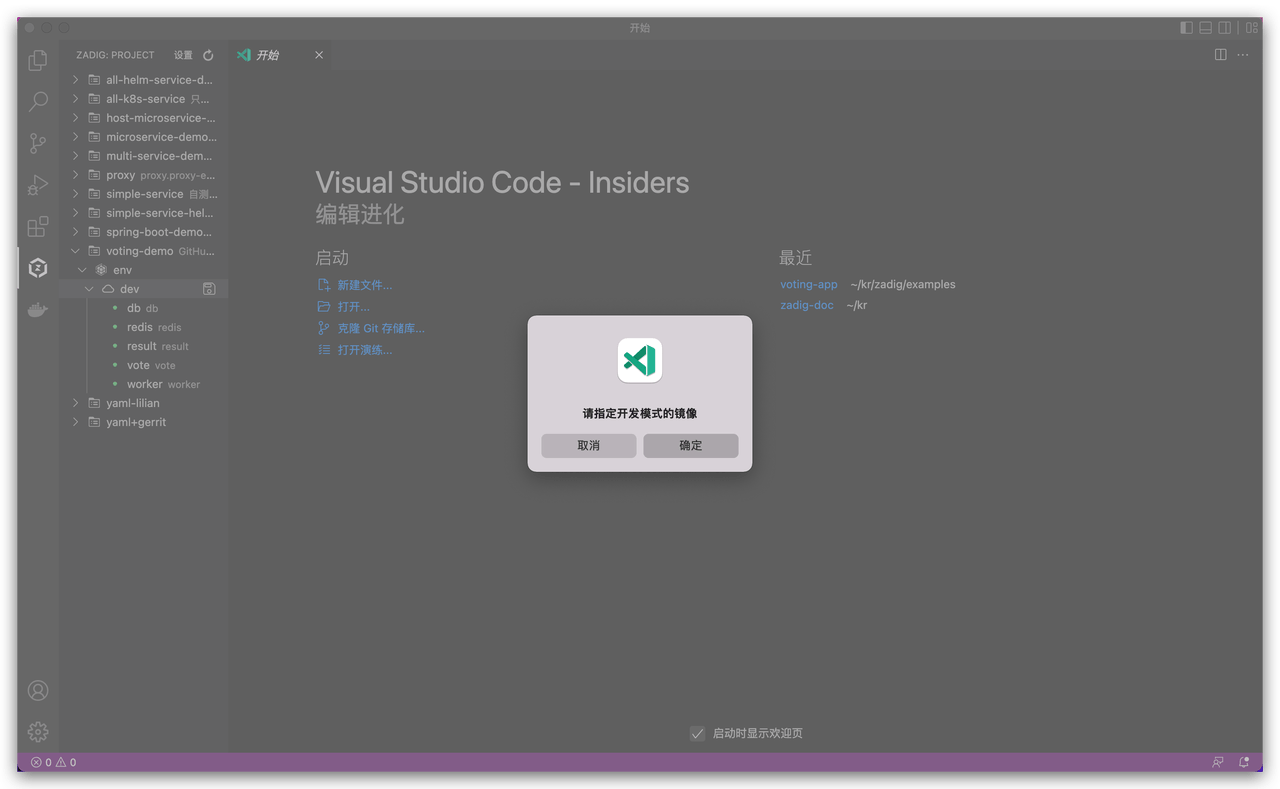
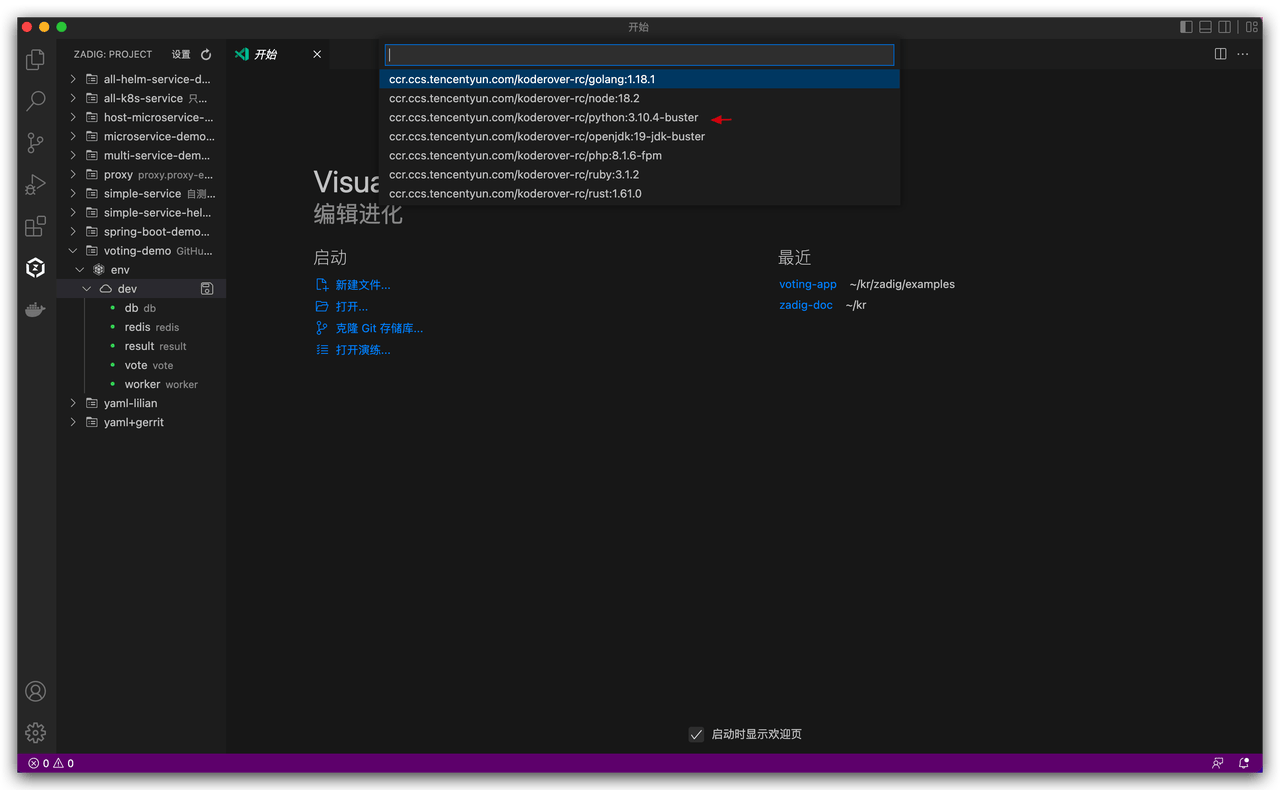
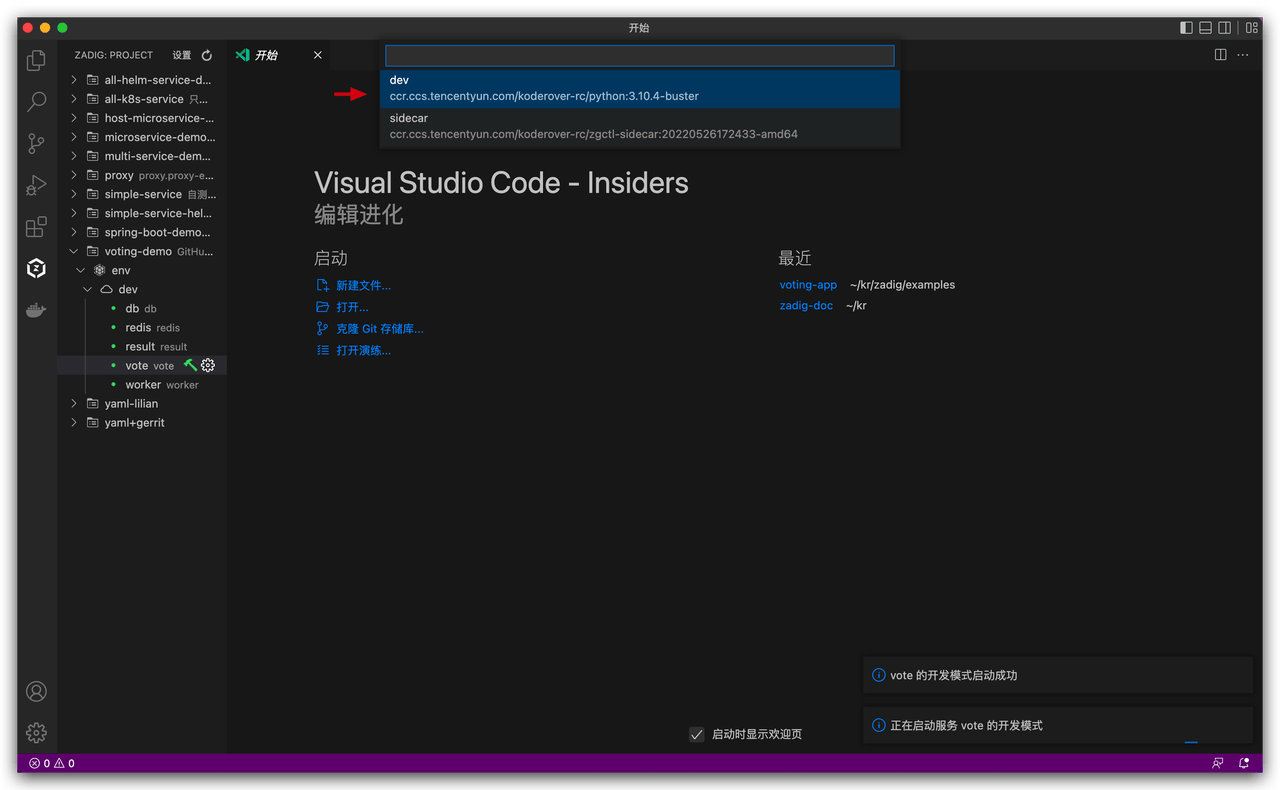
- Select the base image
python:3.10.4-busterfor the development environment.
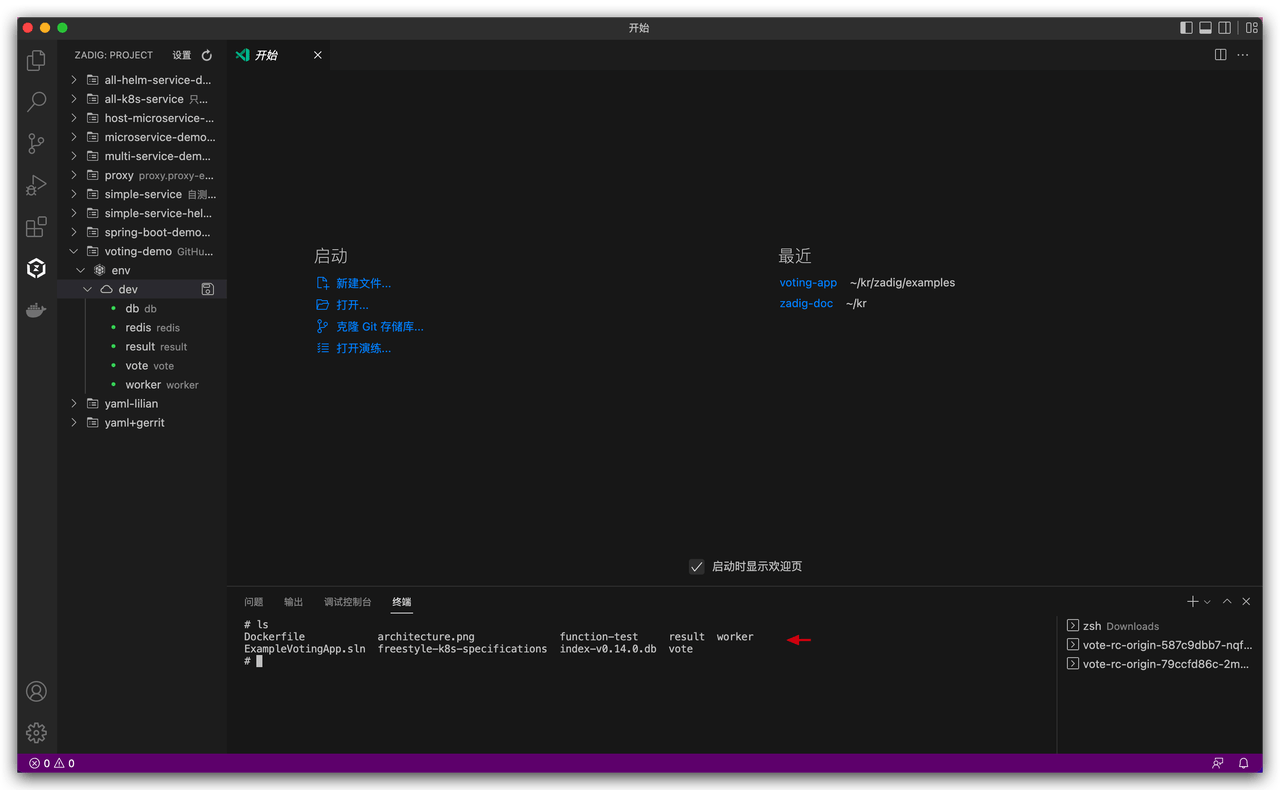
- Wait a moment for the development mode to start and complete, then enter the development container
dev, the content in the selected directory will be automatically synchronized to the development container.
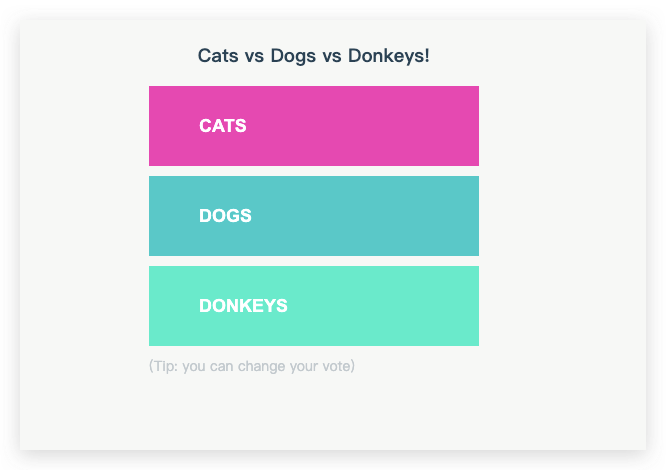
- Modify local code and save: Change the background color of the first vote button.
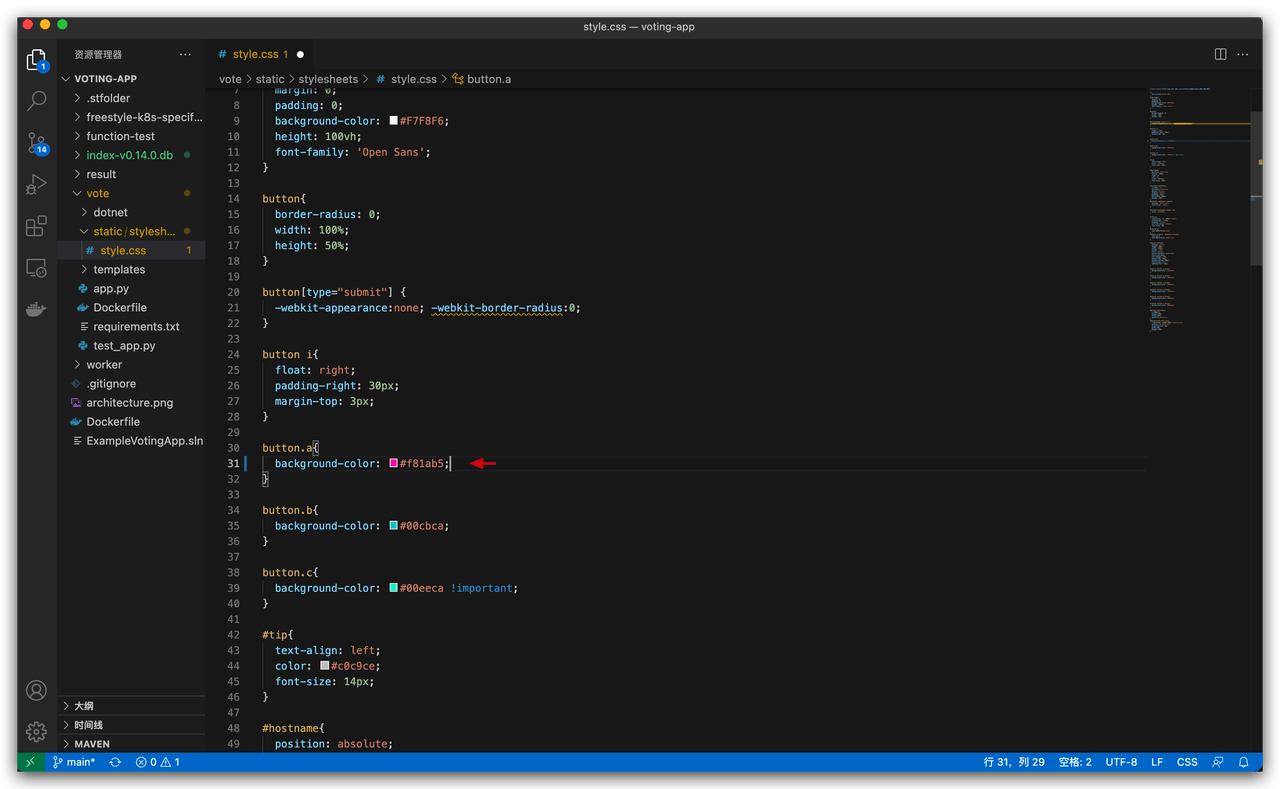
- The modified code will be automatically synchronized to the remote
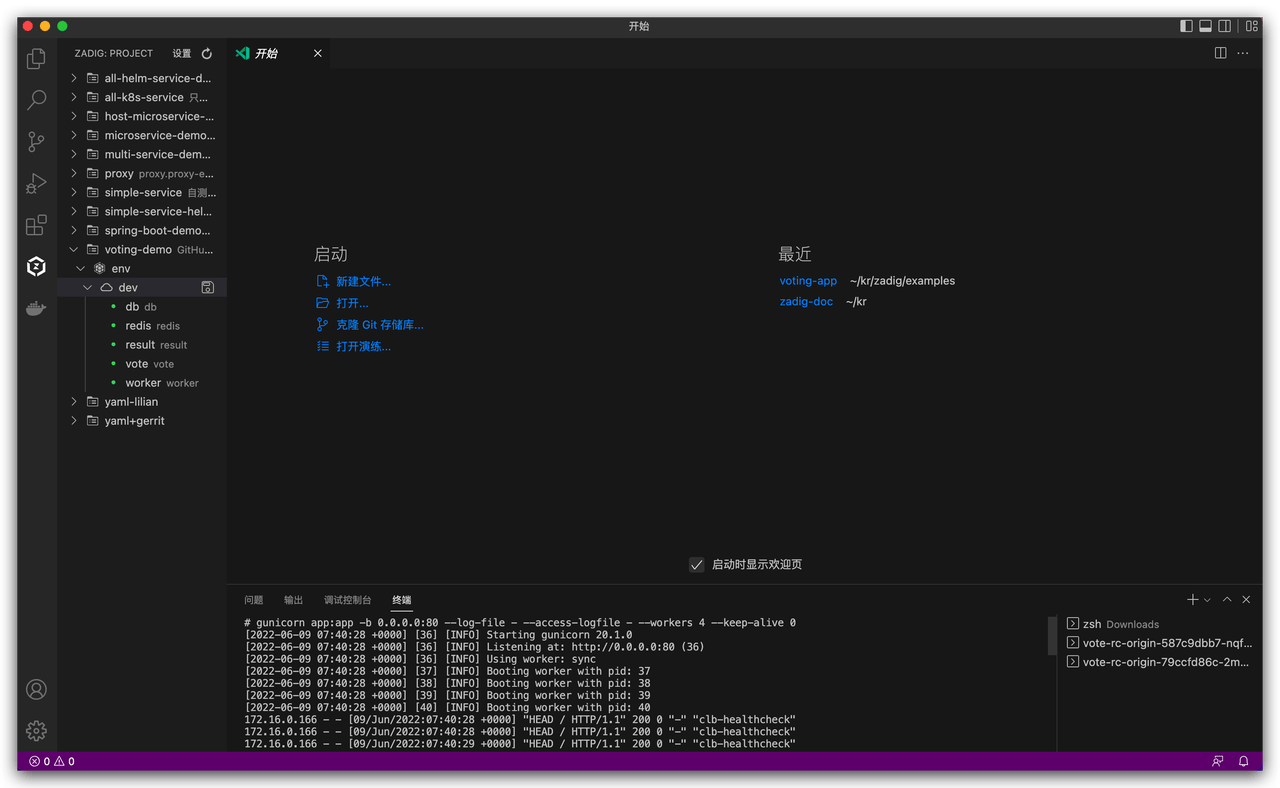
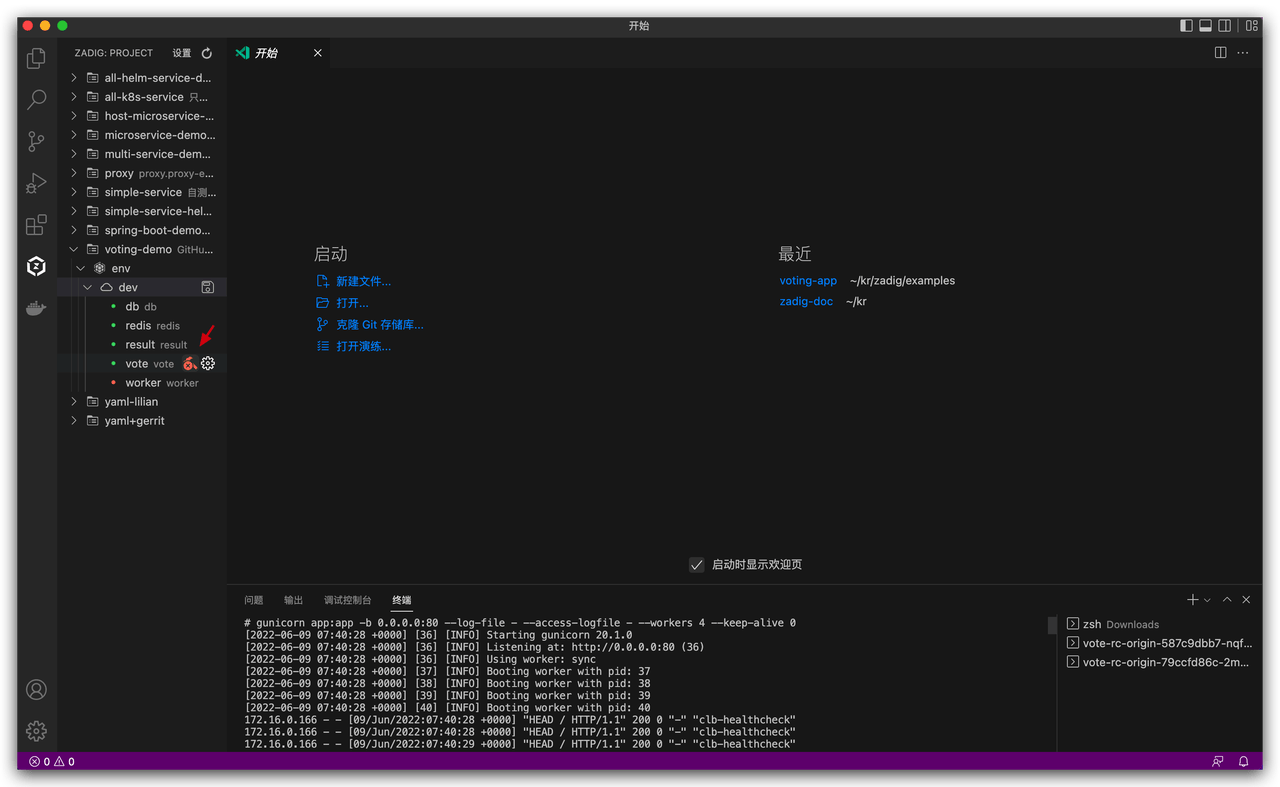
devdevelopment environment. In the terminal, enter thevotedirectory and execute the startup command.
pip install -r requirements.txt -i https://mirrors.aliyun.com/pypi/simple/
gunicorn app:app -b 0.0.0.0:80 --log-file - --access-logfile - --workers 4 --keep-alive 0
2
- Access the vote service address, the modification result is shown in the figure below.
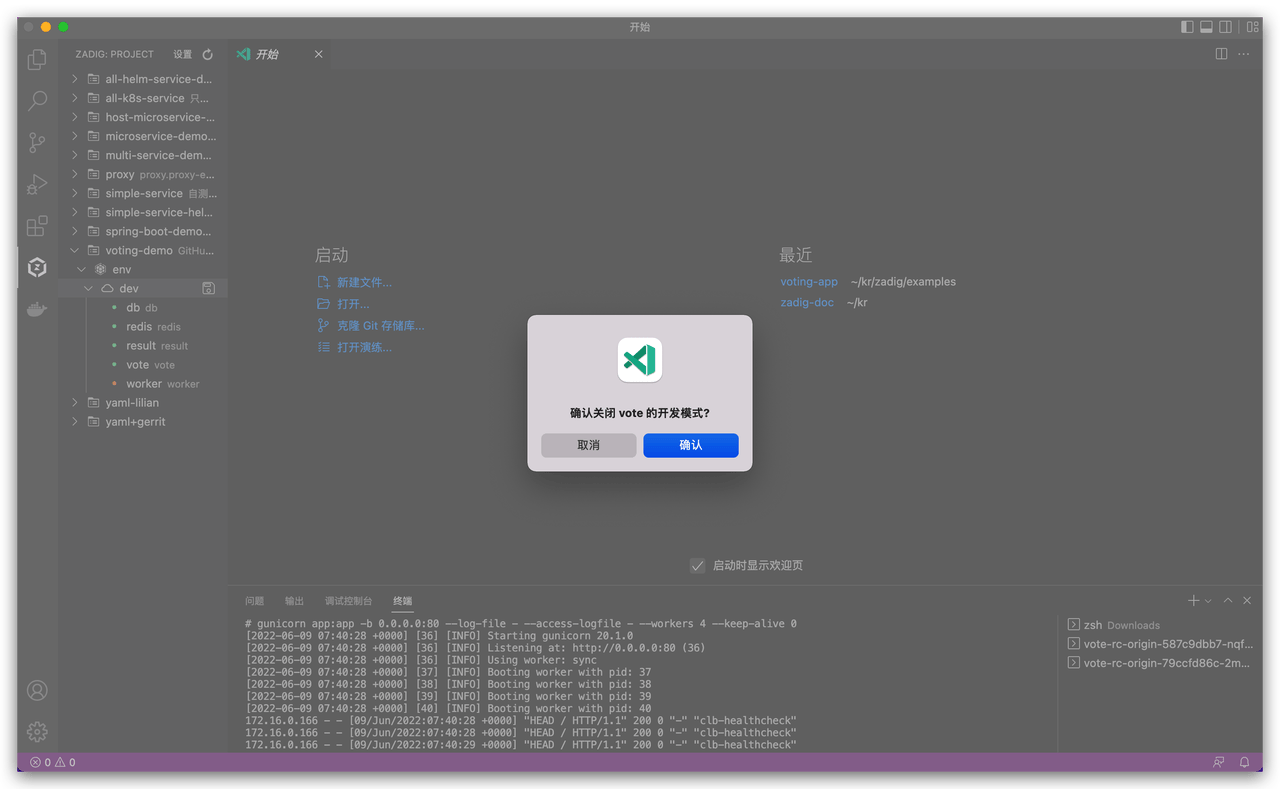
- Click the red button to confirm ending development mode, the container returns to normal.
At this point, a complete local debugging process demonstration is finished.
# View Environment and Services
During daily integration testing, you need to diagnose services. Through Zadig Toolkit, you can view service status, restart services, replace service images, view real-time service logs, and login to the corresponding Pod of the service.
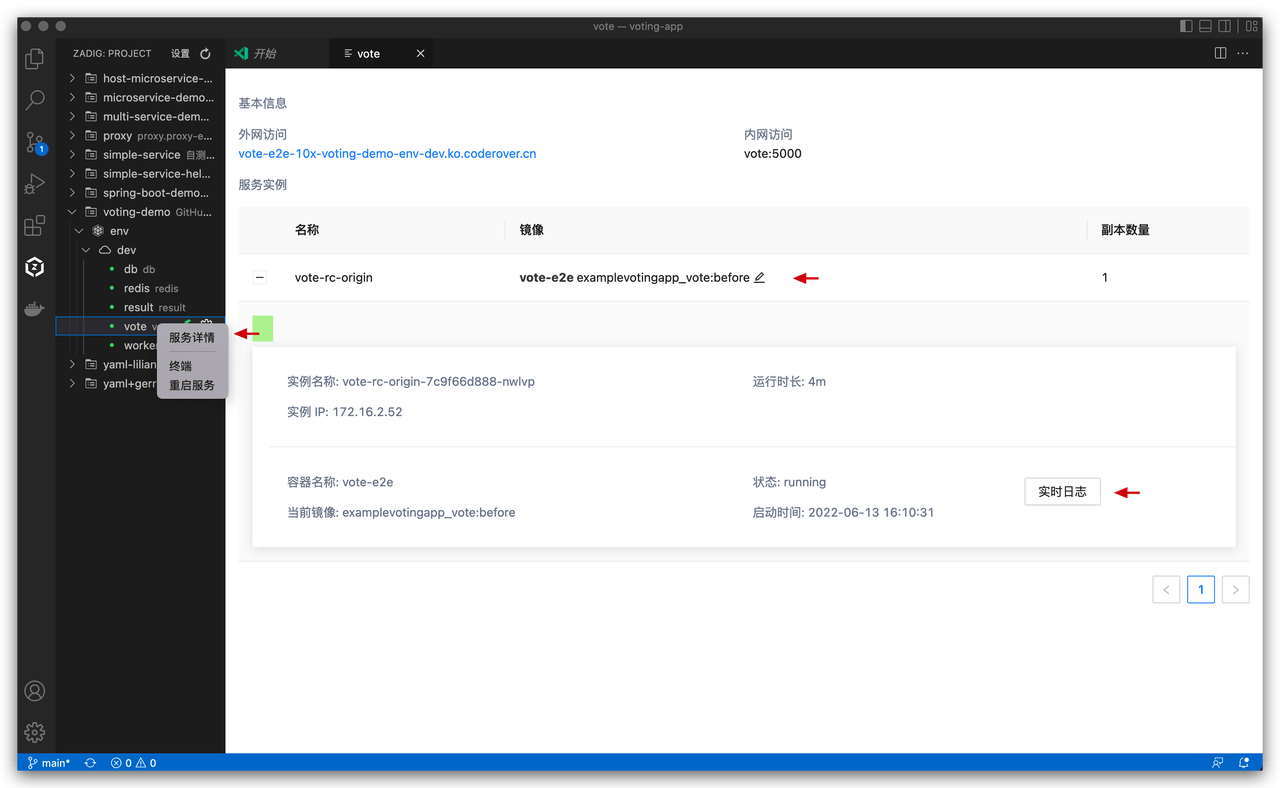
- Right-click on a service to view service details. In the service details page, you can view real-time service logs, and click the edit icon on the right side of the image to modify the service image.
- Right-click on a service, then click
Restart Serviceto restart the service.
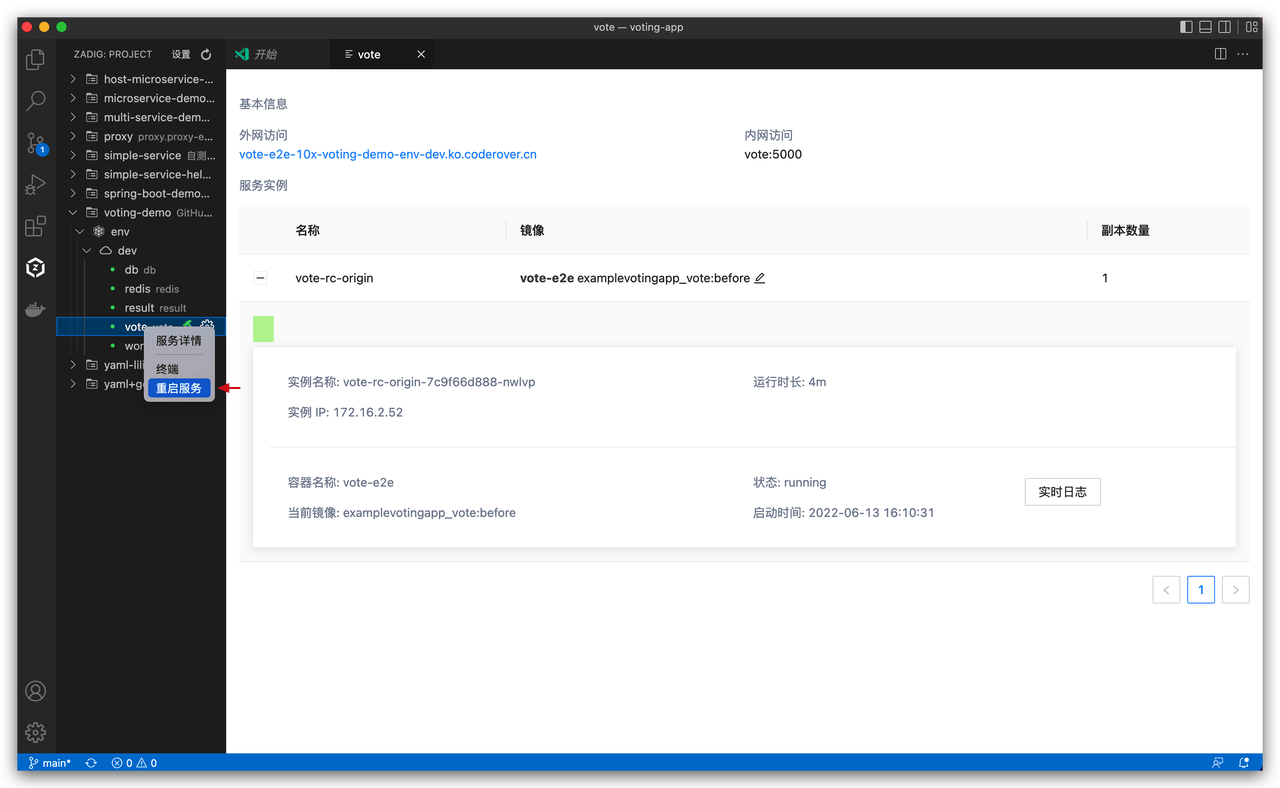
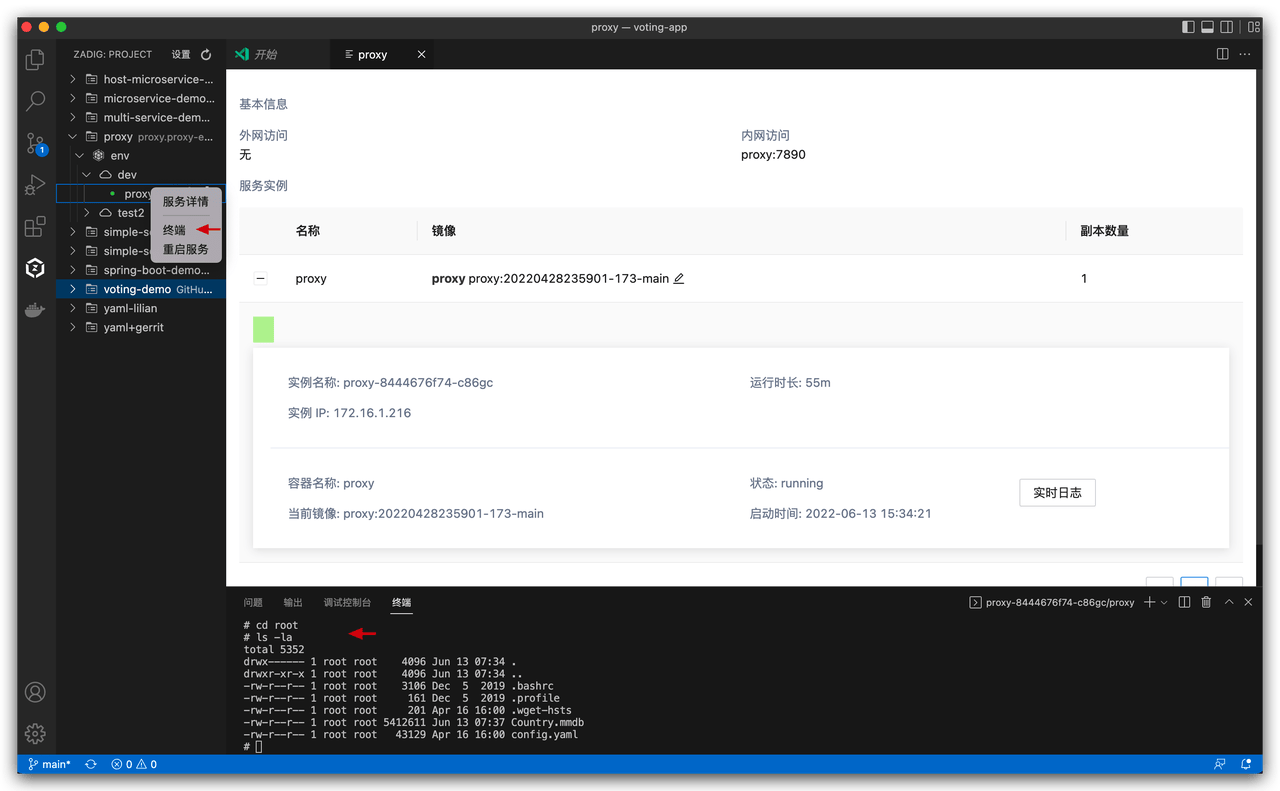
- Right-click on a service, click
Terminalto login to the corresponding Pod of the service.
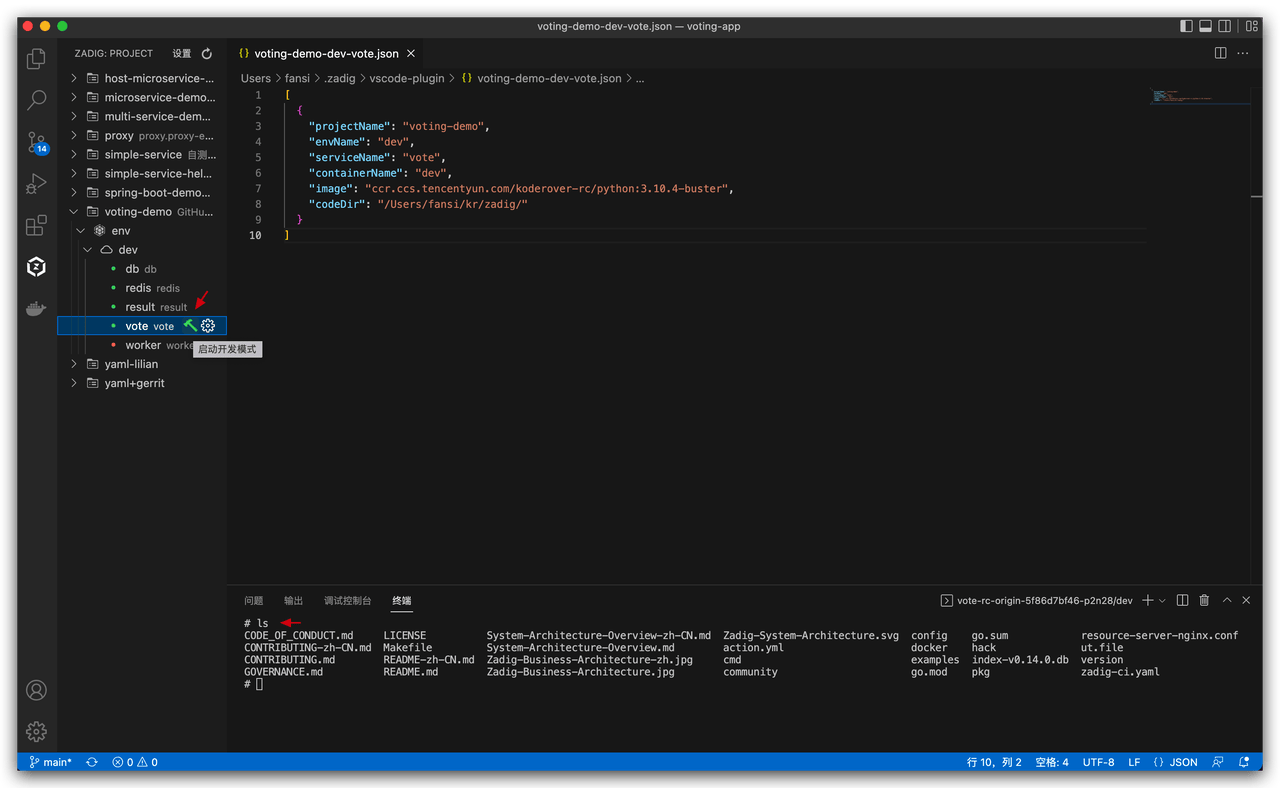
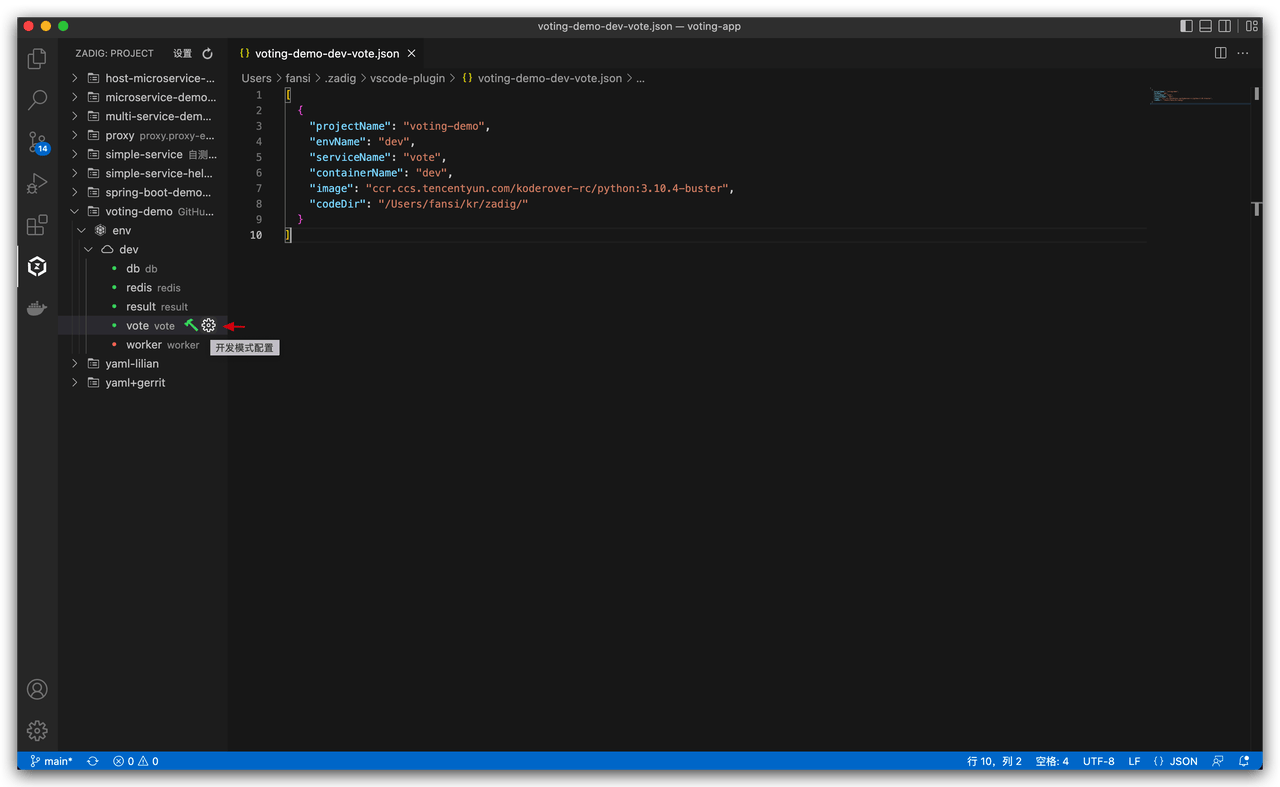
# Configure Remote Development Environment
- When you need to modify the base image of the development environment, or modify the synchronized local code directory, you can quickly set it by clicking the
Development Mode Configurationbutton.
Description of each field in the configuration:
[
  {
    "projectName": Project name,
    "envName": Environment name,
    "serviceName": Service name,
    "containerName": Development environment container name,
    "image": Development environment base image,
    "codeDir": Local directory synchronized to the development environment container
  }
]
2
3
4
5
6
7
8
9
10
- After saving the custom development mode configuration, click
Start Development Mode, and it will quickly start development mode based on the information in the configuration file.